

With skill and finesse!
They said it can’t be done with Dashboards. But they are WRONG…. So Wrong!
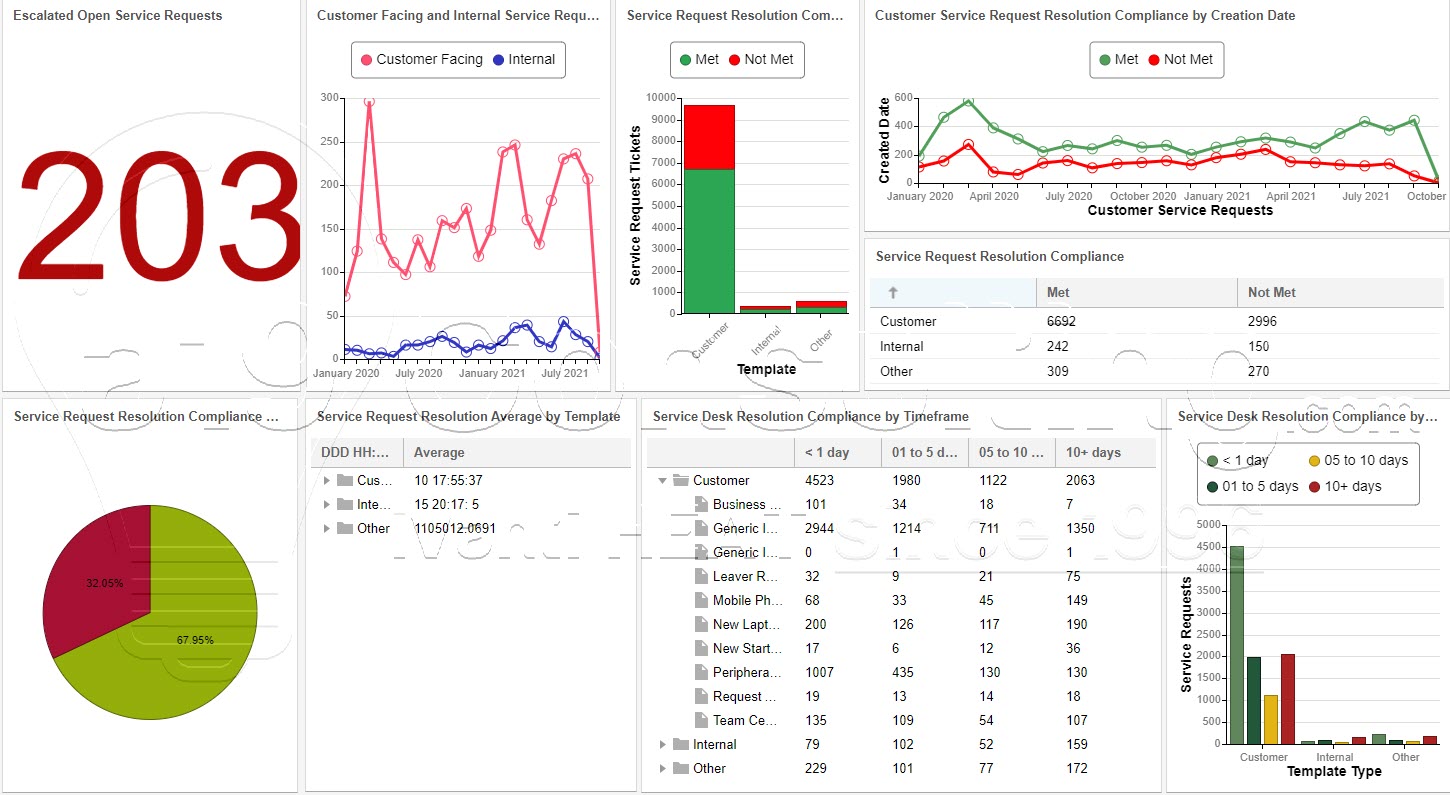
- Yes, you can add Hours of Operation Calculations to dashboards!
- Yes, you can add averages to dashboards!
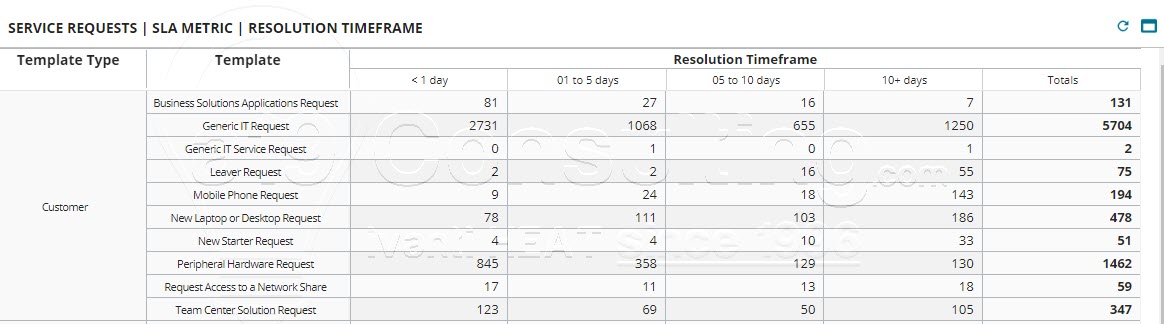
- Yes, you can add aged groups to dashboards!
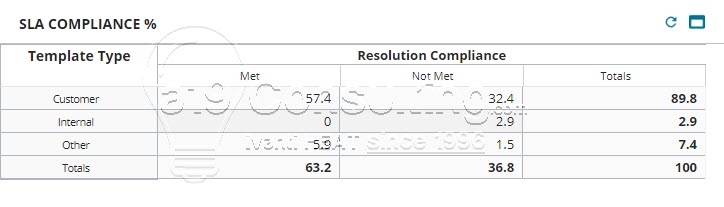
- Yes, you can add percentages to dashboards!
- Yes, you can display data from multiple business objects on one dashboard!
That’s right. DASHBOARDS. Not Reports, not Xtraction, not Power BI, not some other non-native Ivanti Add-On.
Why dashboards and not reports?
- Reports are ugly outdated third-party with many limitations and no development effort committed to by Ivanti. In fact in 2017 Rapid Reports was introduced for native reporting to replace Reports. Dashboards are sexy and here to stay!
- Reports are not native, meaning you can not drill-down to the record in Ivanti Service Manager (HEAT). With Dashboards you can!
- Reports are OK for distribution. If you’re stuck in the 90s!! In today’s shift-left world, the focus is on enabling the Analyst, Manager, Executive with meaningful, timely (LIVE), interactive information in an easy to use simple intuitive interface. With Dashboards you get LIVE interactive meaningful well presented statistics!
With dashboards you can add Hours of Operation Calculations, averages, aged groups, and data from multiple business objects (Incident AND Service Request for example) and much much more.
Are you getting the most out of your Ivanti Reporting?
You are not! Not until you talk to us!


You must be logged in to post a comment.