Service Request SLA Compliance with Targets Met Hours of Operation Calculation Aging Aged Grouping Averages Percentages multiple business objects charts pies graphs analytic metrics dashboards Ivanti HEAT UK Australia

Ivanti HEAT Neurons Christmas Lights

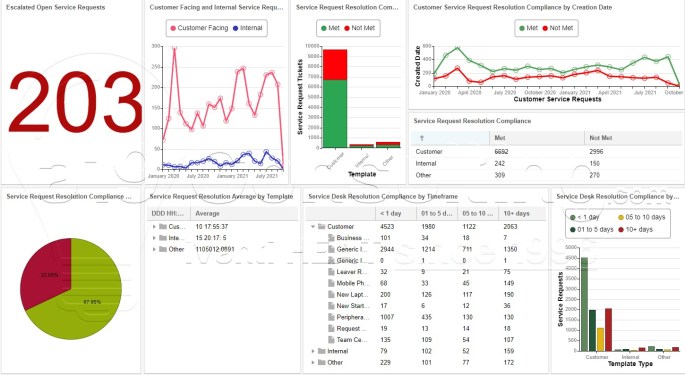
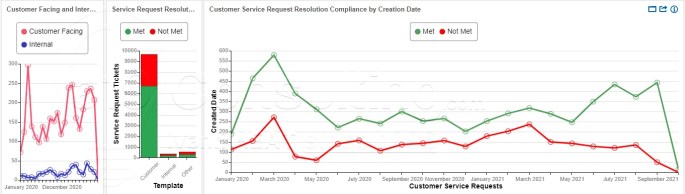
If your dashboards aren't lighting up like a Christmas tree, and yes I mean green for good and red for bad, for your KPIs and Metrics, including hours of operation calculations, averages, percentages, trends, and complex groupings, then we need to talk.

How do you add SLA Metrics such as Compliance, Average Duration, Percentages, and Hours of Operation Calculations to Dashboards?

With dashboards you can add Hours of Operation Calculations, averages, aged groups, and data from multiple business objects (Incident AND Service Request for example) and much much more. Reports are ok if you're stuck in the 1990s!!

freelancer, freelance consultant, itsm, itam, CRM, development, project management, Ivanti Neurons experience, Ivanti Service Manager experience, Ivanti Asset Manager experience, HEAT ITSM experience, UK, EU, APAC, Australia, New Zealand, Singapore, Canada, USA, Ivanti Business Partner experience

Rapid Dashboards

Rapid Reports was a great enhancements to allow end users to quickly create list and form reports based on Saved Searches. Another need that many customers have is "Rapid Like Dashboards", more specifically, end users (Executive/Managers/Analysts) require on-demand dashboards to quickly produce a chart, graphic, pivot table, etc.